
As global trade continues to experience rapid changes, international firms are continually seeking means to increase revenue and market share. Their strategies could include diversifying products/services, seeking new markets and better suppliers, prioritizing trade with certain partner countries, among others.
However, to arrive at the best decision and effectively utilize resources, international organizations need statistical information on global trade worldwide. This data provides insight into international demand, export performance, and relevant trade indicators.
In this article, we explore how to access the international trade data of different countries and regions. Organizations can get to know each country’s overall imports and exports, trade balance, and trading partners’ details globally.
The International Trade Centre’s website features a trade map that provides trade statistics and market access information for 220 countries and territories. The map shows all 5,300 products of the Harmonized System (HS) in a user-friendly, web-based format.
Additionally, the Market Info & Tools Page of the website has links to limited versions of the trade map, accessible without registration. It provides information on the yearly and monthly international trade statistics for commodities and services for 19 years. However, you can get uninterrupted access to the trade map by registering an account.
Here are common questions providing answers on how to access the trade data.
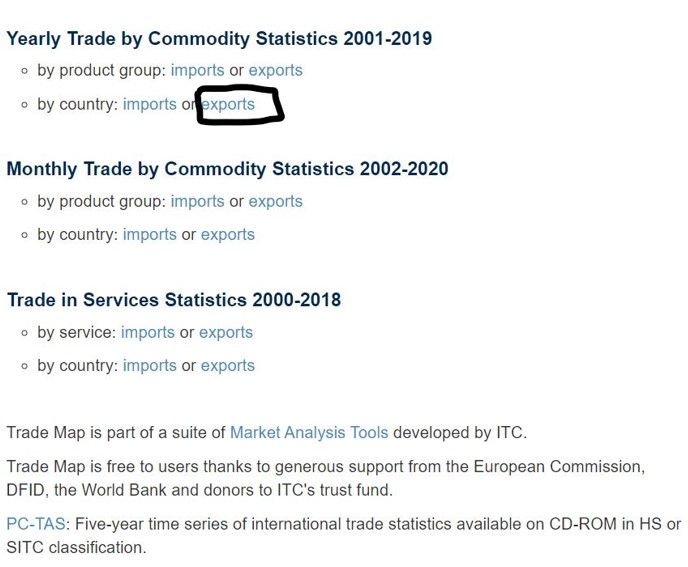
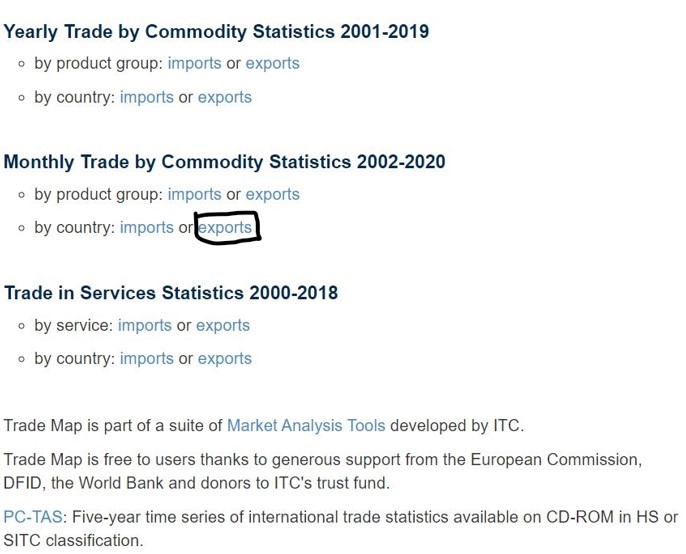
There are three subheadings from the screenshot of the Market Info & Tools web page, with the first being ‘Yearly Trade by Commodity Statistics 2001-2019.’ If you want to know America’s biggest export, you’ll need to click on ‘exports’ by country, as indicated in the screenshot.
After clicking, you’ll get a webpage showing you a list of the 220 countries and territories featured in the trade map, in alphabetical order. Then click on “United States of America’.

A table then opens, showing you the export data for five years.

If you want to get data for more years, click inside the box beside ‘Time Period (number of columns)’ as indicated in the screenshot. You can then select 5, 10, 12, or 20 pages, representing the number of years.

You’ll observe that there are ellipses among the list of products in the third column, indicating that they’re not entirely listed. To expand the list, click on the double arrow image beside the ‘product label.’

You can also arrange the products in alphabetical order by clicking on ‘product label.’

If you study the cells containing the numbers of exports, you’ll observe that only one column (2019) has its arrangement in descending order. Therefore, you can know America’s biggest export for 2019.
The other columns aren’t arranged in any order. However, a click on each column’s heading will give you that year in descending order of exports. Another click will arrange the column in ascending order. Here are illustrations using year 2016.
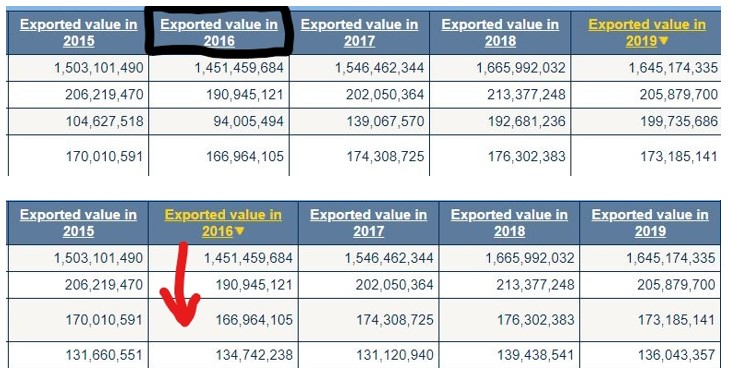
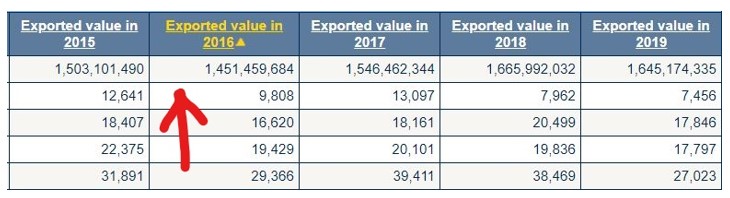
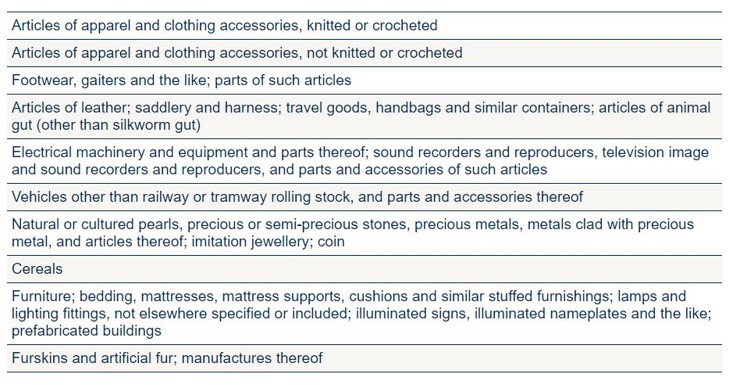
After successfully arranging any column in descending order, you can get America’s biggest export for that year.
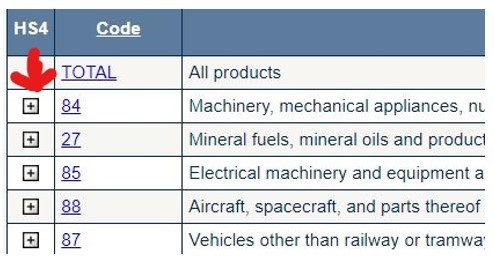
For instance, the biggest export for 2016, according to the 2-digit level of the harmonized system, is products listed under code 84. These products are Machinery, mechanical appliances, nuclear reactors, boilers, parts thereof. They had a total export value of $190,945,121 million.
![]()
Similarly, if you check for the other 18 years’ biggest exports, they’re still the products with HS code 84. You can click on the cells in the first column to expand the 2-digits level, to give you products at 4-digits, 6-digits level, and products at the tariff line for each product classification.
To get America’s biggest exports from the tariff line level, click ‘products at the tariff line’ as indicated in the screenshot. The biggest export from the table is civilian aircraft, engines, equipment, and parts (code: 8800000000) with a value of $125,489,864.

Here’s an illustration to get Cambodia’s top ten Exports. Following the example of America’s biggest exports, we’ll begin our search from the web page containing the list of countries and territories. Scroll to Cambodia, which you’ll find on the right-hand side of the list, and click.

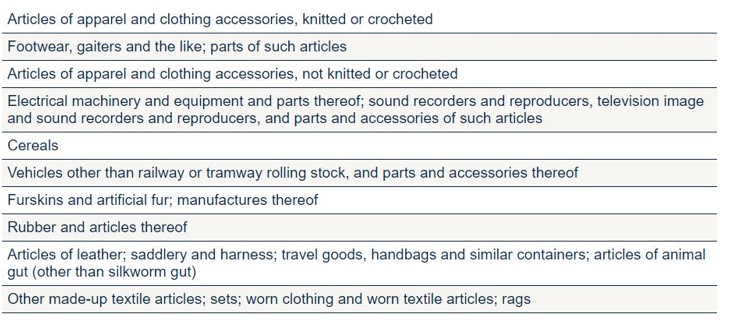
The page opens to display the table containing five years of data. You can add more pages to reveal more or less the number of years as you need. From the table, Cambodia’s top ten exports for 2019 under the 2-digits level are:
While the top ten exports for 2015 are:
Now that you’re familiar with getting exports, getting Cambodia’s top ten imports will be easy. We’ll stick with the data containing ‘Yearly Trade by Commodities Statistic 2001-2019’ for this illustration. This time, you’ll need to click on ‘imports’ in ‘by products.’

As expected, you’ll get a list of countries and territories, then click on Cambodia. The data clearly shows that Cambodia’s top ten imports for the 2-digit level for 2019 are:

To obtain the top ten imports for other years, click on the headings of each year.
If you want to know France’s Exports by year, it should be easy from previous illustrations. However, to answer this question, we’ll use the monthly data indicated in the screenshot.

Click on ‘exports’ in ‘by country.’
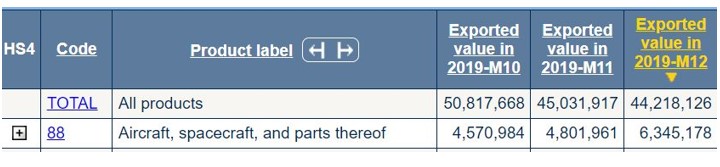
A list of countries will appear and the duration of which there’s available data. Select ‘France’, and a table will appear. From the screenshot, you’ll notice that there’s data for 2019-M10 (October 2019) to 2020-M09 (September 2020).

You can always get data for more months by increasing the number of columns. In the third column, you’ll find answers to France’s exports. For instance, France’s biggest exports in December 2019 were aircraft, spacecraft, and parts thereof, with a value of $6,345,178.
The biggest exports for September 2020 are Machinery, mechanical appliances, nuclear reactors, boilers, parts thereof, at $5,036,618.
However, these products are arranged in the 2-digits level of the Harmonized System. To convert to 4-digits, 6-digits, and tariff line level, expand each column from the cells under the first column.
We’ll answer this question using the unlimited version of the Trade Map, which gives you a real picture of how the tool works. From the Market Info & Tools web page, click on Trade Map.

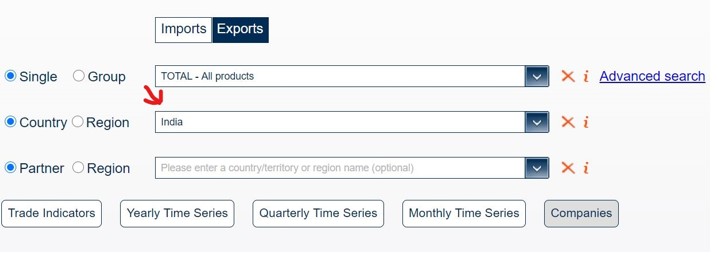
The trade map tool opens to reveal the homepage. From here, type ‘India’ into the field illustrated below.
Then click on Region and type “Africa” into the field illustrated in the screenshot below.
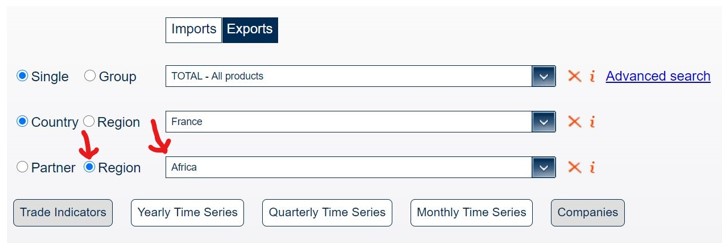
Click on ‘Yearly Time Series’

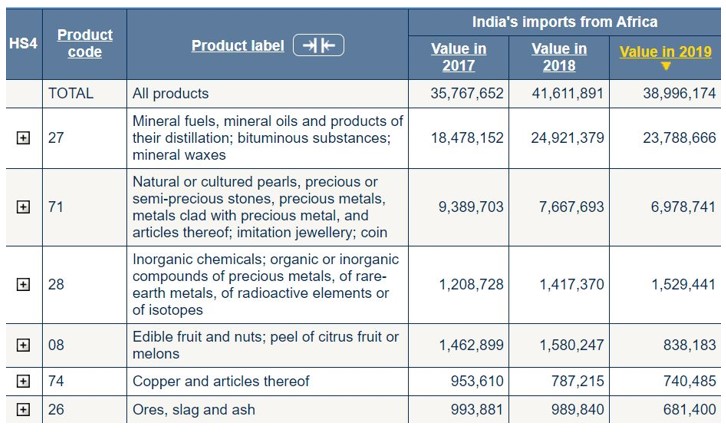
You’ll get a table whose 4th, 5th, and 6th columns indicate the values of India’s Exports to Africa for 2016 -2019.
From the third column, you can see a list of all the products India exports to Africa. For several years, the top products are mineral fuels, mineral oils, and products of their distillation, bituminous substances, and mineral waxes.
From the Trade Map’s homepage, type in ‘Bolivia’ in the field indicated below.
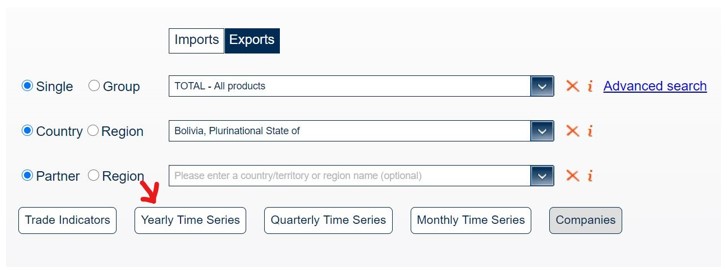
Then click on ‘Yearly Time Series.’ The table that displays show Bolivia’s main trading partner in exports for five consecutive years as Brazil. Bolivia’s leading trading partner in exports is still Brazil when you increase the number of columns to get data for more years.

To get her main trading partner in imports, click on the field for ‘other criteria’ and select ‘imports.’
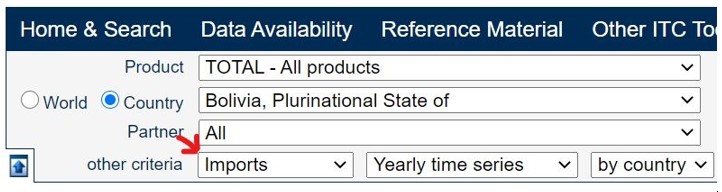
Bolivia’s main trading partner in imports is China.
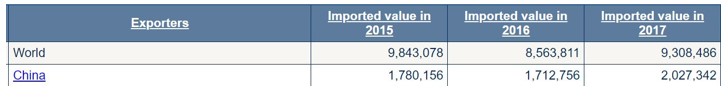
From the table showing Bolivia’s trading partners, select ‘China’ from among the list of countries.

Go to the ‘other criteria’ section, click on the first field, and select ‘exports.’ Then select ‘by product.’ in the third field.

A table will display, showing you China’s main exports for different years.

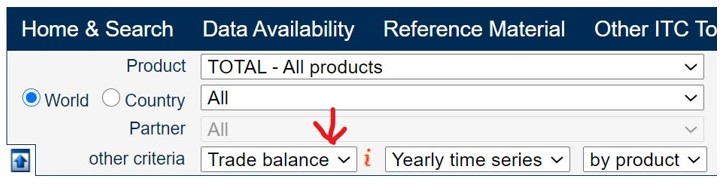
ITC’s Trade Map features data of foreign trade across the world. From the tool, you’ll find a list of search terms at the top. Click on ‘World’ in the second row.

The table that displays will show you the imported value (in US dollars) of a list of products for different years. From the table, you can tell that the total imported value of all products for 2019 is $19,053,751,467 billion.
You can go to the ‘other criteria’ section on the top of the trade map and select exports to see the total exports by year. Similarly, when you select ‘trade balance,’ you’ll see the difference between import and export values for each year.
You can also get foreign trade data by services, by countries, and in different currencies.
Different online platforms provide information about exports and imports across the globe. One such website is the International Trade Centre.
The website has different tools, including World Access Map, Trade Competitiveness Map, Procurement Map, Export Potential Map, Investment Map, and Market Analysis.
The Trade Map is one of the Market Analysis tools. It’s a user-friendly and free online tool that provides global trade data for public and government use. It offers access to export performance indicators, international demand, alternative markets, and the role of competitors.
Additionally, you can access these data on a monthly or yearly basis from the product, service, and country perspectives.